Introduction
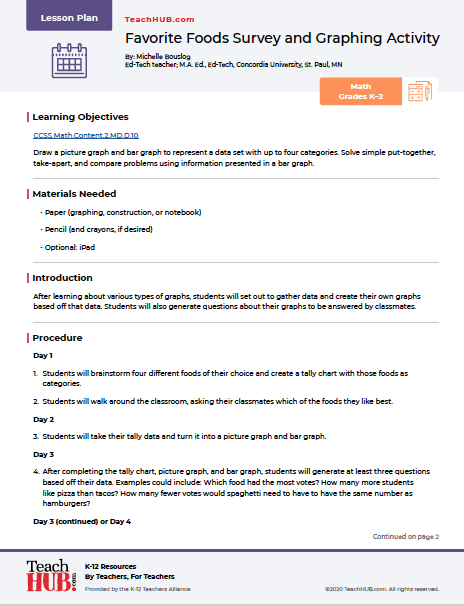
After learning about various types of graphs, students will set out to gather data and create their own graphs based off that data. Students will also generate questions about their graphs to be answered by classmates.
Learning Objectives
Draw a picture graph and bar graph to represent a data set with up to four categories. Solve simple put-together, take-apart, and compare problems using information presented in a bar graph.
For the full lesson plan, download the PDF.


